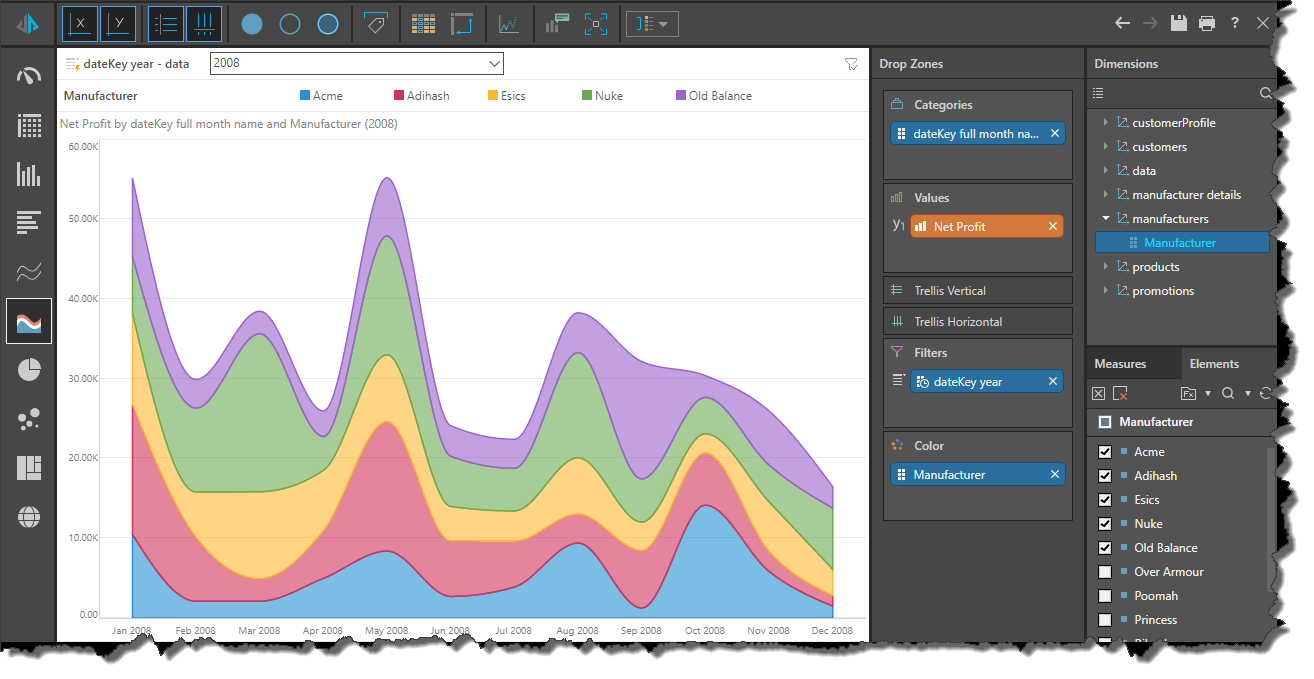
Building visuals using the Discover Lite tool is a simple process of adding hierarchies, elements, and measures to the drop zones from the Dimensions, Elements, and Measures trees.
Process overview
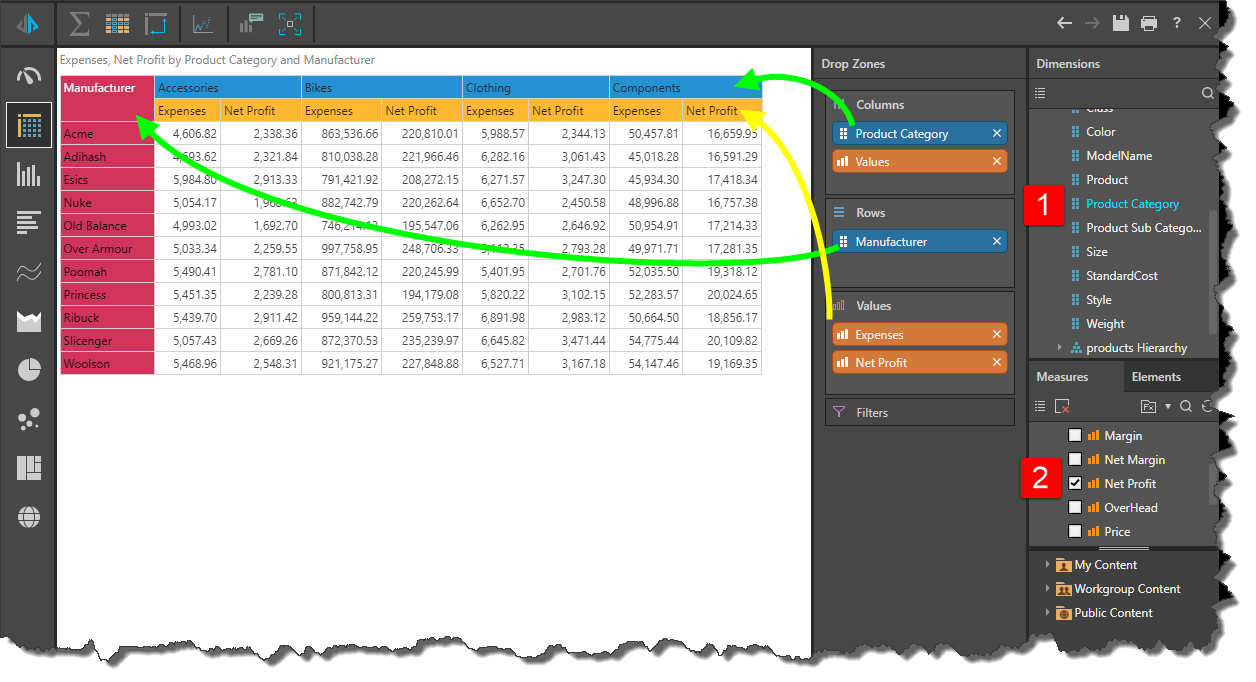
Essentially, you can build your visual in two steps:
- Add at least one hierarchy to the drop zones from the Dimensions panel (green arrows below).
- Add at least one measure to the drop zones from the Measures panel (yellow arrow).
Additional and alternative steps
- An alternative to step 1 is to filter the elements within a hierarchy, using the checkboxes in the Elements panel (see below).
- You can add multiple hierarchies, elements, measures, and custom formulas and lists to the drop zones.
- You can also change the visualization type that you want to use to present your data from the toolbox, dynamically interact with your visual using the right-click context menus, and add forecasting to your visual.
These steps can be performed in practically any order. This flexibility afforded by Pyramid is designed to support "on the fly" data analysis, so that you can explore your data model spontaneously, without the need for planning or following complex steps. This approach gives you free rein to easily discover interesting trends in your data.